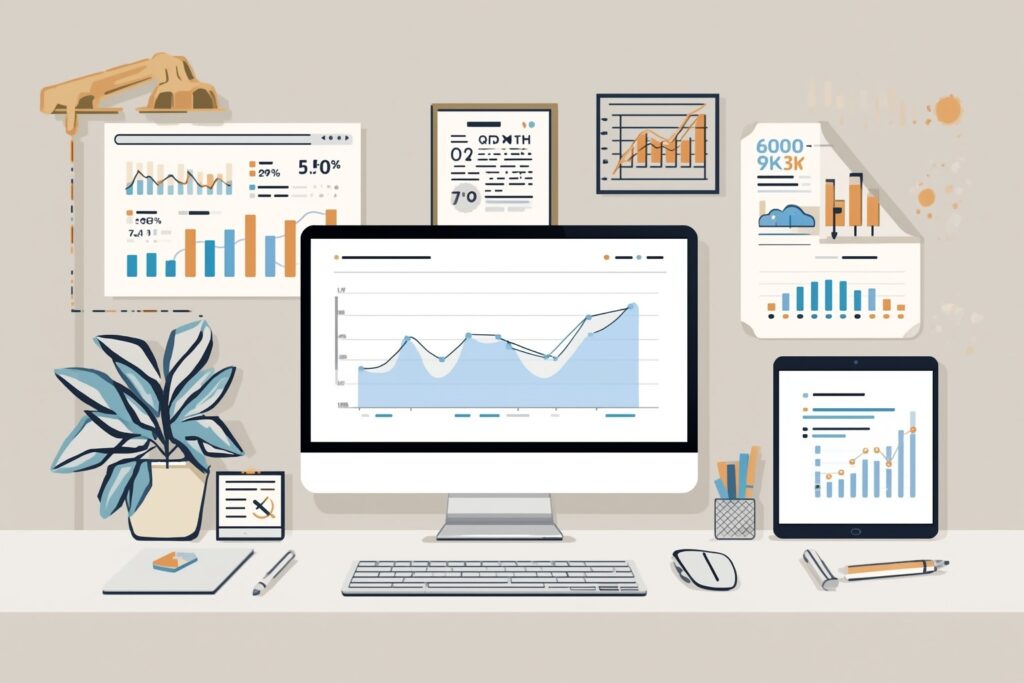
Dashboards that Actually Drive Decisions (Not Vanity)
In today’s fast-paced business environment, data is king. However, many business owners and managers find themselves overwhelmed by the sheer volume of information at their fingertips. It’s easy to create dashboards filled with metrics that look impressive but fail to provide actionable insights. The key to effective dashboard design lies in understanding how to present data that drives decisions rather than just vanity metrics. In this article, we’ll explore practical steps to create decision-driving dashboards for remote finance teams.
1. Define Your Key Performance Indicators (KPIs)
The first step in creating an effective dashboard is to identify your Key Performance Indicators (KPIs). These are the metrics that matter most to your business and should be aligned with your strategic objectives.
- Revenue Growth: Measure the increase in revenue over time.
- Profit Margin: Assess your profitability after accounting for all expenses.
- Cash Flow: Monitor the inflow and outflow of cash to ensure liquidity.
- Customer Acquisition Cost: Calculate the cost associated with acquiring a new customer.
By focusing on KPIs that directly impact your bottom line, you can ensure that your dashboard is not just a collection of data, but a tool for decision-making.
2. Choose the Right Visualization Tools
The effectiveness of a dashboard heavily relies on how data is visualized. Here are some visualization options that can help in presenting your KPIs clearly:
- Bar Graphs: Ideal for comparing multiple data points, such as revenue across different products.
- Line Charts: Best for showing trends over time, such as cash flow fluctuations.
- Pie Charts: Useful for illustrating how a single category contributes to a whole, such as market share.
Choose visualizations that make it easy to interpret data at a glance. Avoid cluttering your dashboard with too many different types of visuals, as this can lead to confusion.
3. Implement Real-Time Data Updates
Static reports are a thing of the past. Today, decision-makers require real-time data to respond to market changes swiftly. Ensure your dashboard integrates with your financial software to provide live updates. This capability allows you to:
- Identify trends as they happen.
- React to cash flow challenges immediately.
- Make informed decisions based on the latest data.
Real-time insights can be the difference between capitalizing on opportunities and missing out due to outdated information.
4. Prioritize User Experience
A user-friendly interface is crucial for a dashboard that drives decisions. Here are a few tips to enhance user experience:
- Simplicity: Keep your dashboard clutter-free. Limit the number of metrics displayed to avoid overwhelming users.
- Customization: Allow users to customize their view according to their roles. A sales manager may need different metrics than a CFO.
- Mobile Accessibility: Ensure the dashboard is accessible on mobile devices for on-the-go decision-making.
By prioritizing user experience, you empower your team to engage with the data effectively, which can lead to faster, more informed decisions.
5. Incorporate Actionable Insights
Your dashboard should do more than just display data; it should provide actionable insights. This can be achieved by:
- Highlighting Alerts: Use alerts to notify users of critical changes, such as a sudden drop in cash flow.
- Providing Recommendations: Include suggestions based on the data, like adjusting spending in response to lower-than-expected revenue.
- Linking to Further Analysis: Allow users to drill down into the data for more detailed insights when necessary.
By incorporating actionable insights, you can turn your dashboard into a strategic tool that enhances decision-making rather than just presenting data.
6. Regularly Review and Update Your Dashboard
Business needs evolve, and so should your dashboard. Regularly review the effectiveness of your KPIs, visualizations, and user engagement. Consider the following:
- Are the KPIs still relevant to your current business goals?
- Is the data visualization still effective for your team?
- Are users consistently engaging with the dashboard?
By conducting regular audits, you can ensure that your dashboard continues to serve its purpose as a decision-driving tool.
Case Study: A Retail Business Transformation
Consider a retail company that was struggling with inventory management and cash flow visibility. They implemented a new dashboard that focused on real-time sales data, inventory levels, and cash flow metrics. By defining KPIs that aligned with their business goals, they were able to:
- Identify slow-moving inventory quickly, leading to improved cash flow.
- Make informed purchasing decisions based on real-time sales data.
- Reduce excess inventory costs by 20% within six months.
This transformation illustrates how a well-designed dashboard can drive significant business decisions and improve financial health.
TL;DR
- Define KPIs that align with strategic business goals.
- Choose effective visualization tools for clarity.
- Implement real-time data updates for timely decisions.
- Prioritize a user-friendly experience for increased engagement.
- Incorporate actionable insights to drive decision-making.
- Regularly review and update your dashboard to maintain relevance.
Creating a dashboard that drives decisions rather than merely showcasing data is essential for any business owner or manager. By focusing on the steps outlined above, you can empower your remote finance team to deliver actionable insights that propel your business forward.
If you’re considering enhancing your financial strategy, hire a remote CFO or hire a remote bookkeeper to help you implement these strategies effectively.


Leave a Reply